
 1 year ago
55
1 year ago
55


Which iGaming brand leads the regulated U.S. space in terms of market share, based on gross gaming revenue? How much tax revenue has each state’s regulated online casinos generated this year to date? And in which states are operators generating what kinds of revenue?
This page is a living document, aimed at answering the questions above concerning online gambling statistics, and illustrating the contours and growth of the U.S. regulated online casino market through relevant online casino stats.
The charts and statistics below are presented by Casino Reports in collaboration with independent analyst Alfonso Straffon, a longtime industry observer, former sports trader, and equities analyst at Deutsche Bank. The charts will be updated on a monthly basis, on or about the third Thursday of each month, to reflect the latest state filing data.
Please note: If you make reference to any of the data within, kindly support our efforts and cite this page with a link. If you have any questions about the underlying data or would like further information or clarification or if you spot an inaccuracy, please let us know by writing to brett@thirdplanet.us.
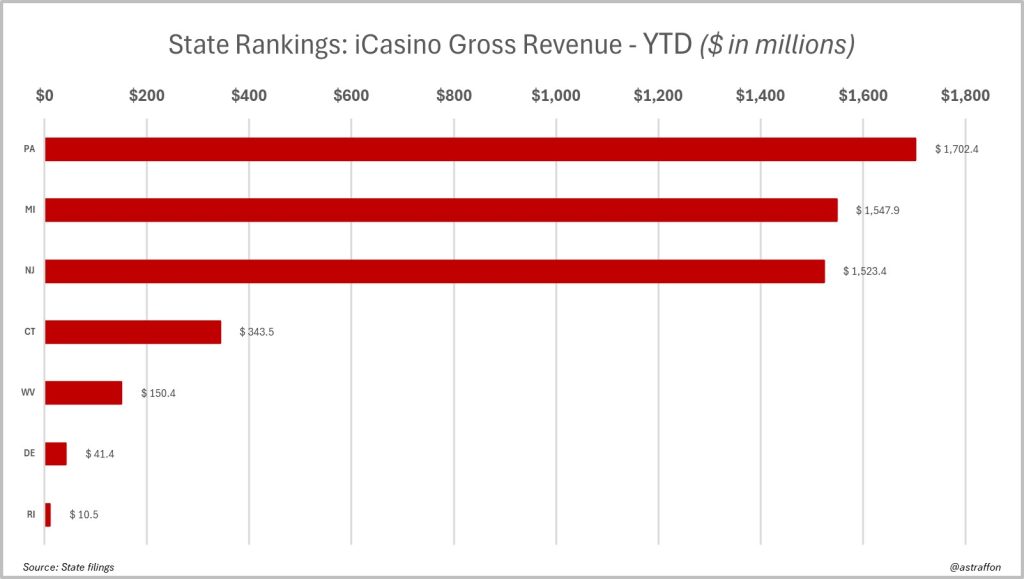
iCasino gross gaming revenue data, Year-to-date (2024)
 (Click to enlarge)
Key Takeaways
- Operations in Michigan, New Jersey and Pennsylvania generate the vast majority of regulated iGaming revenues.
Michigan, New Jersey and Pennsylvania, have effectively become the “revenue triad” in the U.S. market, the epicenter of iGaming activity, states where the major operators have also set up live dealer studios.
If or when New York joins the ranks — discussion is ever ongoing — the chart probably will show New York separating from the group, rather than something resembling a “four horsemen.“
Note that in Delaware, at the end of 2023, the state lottery replaced the brand 888 with Rush Street Interactive to power its online sports betting and iGaming. In September 2024, Rush Street launched live dealer games through Evolution Gaming, available through all three of the state’s licensed casinos.
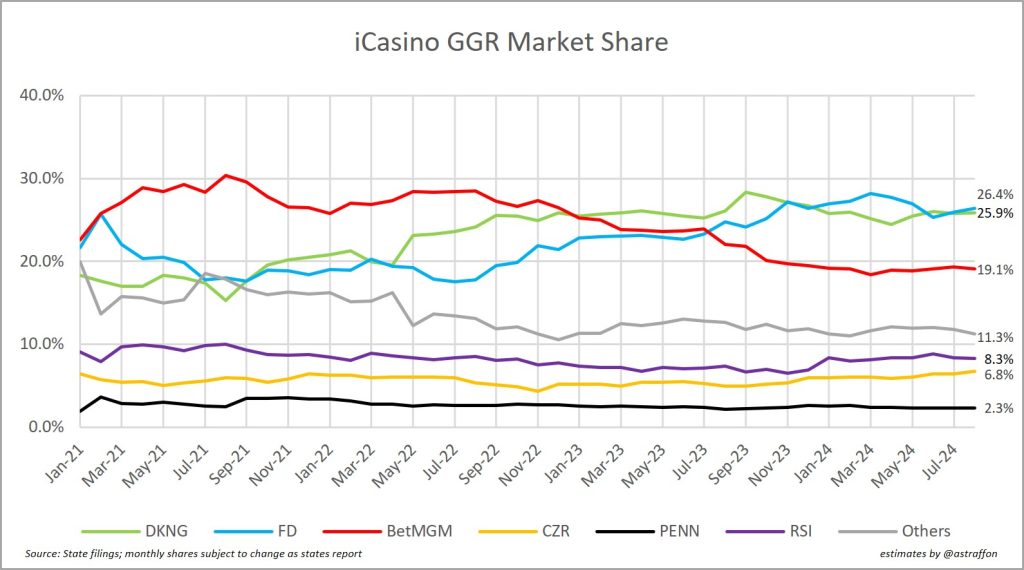
iCasino gross gaming revenue market share stats, January 2021 through August 2024
 (Click to enlarge)
Key Takeaways
- FanDuel Casino and DraftKings Casino have each increased their market share by ~6%, mainly at the expense of BetMGM.
- BetMGM’s market share dropped from 30% to 19.1% since its post-launch phase in Michigan in 2021.
- Rush Street Interactive remains stable at an 8% market share, amid frequent acquisition rumors.
One of the interesting trends captured in this chart is the roughly 6% share increase that both FanDuel Casino and DraftKings Casino have achieved over the past three years; the climb has come at the expense of BetMGM, which at one time in the post-launch phase in Michigan (January 2021) surged to a 30% share, then began an approximate 10-point descent to 19.1% at present.
Both DraftKings and FanDuel have continued to invest in their casino products and have expanded their content libraries. FanDuel Casino has been pushing customers all year toward its World of Wonka slots game while dabbling in other new and exclusive titles, and DraftKings is innovating with a form of peer-to-peer poker available in certain states through its casino app. Meanwhile, all along, Rush Street Interactive (which operates the brands BetRivers and PlaySugarHouse), a frequently rumored acquisition candidate, has held steady at approximately 8%.
Note: For purposes of this chart, revenues deriving from multiple brands affiliated with the same parent company were combined. For example, Flutter owns FanDuel and Pokerstars, which were combined and attributed to FanDuel; meanwhile DraftKings owns and operates Golden Nugget Online Gaming as well as Jackpocket Casino, and likewise for BetMGM and Borgata.
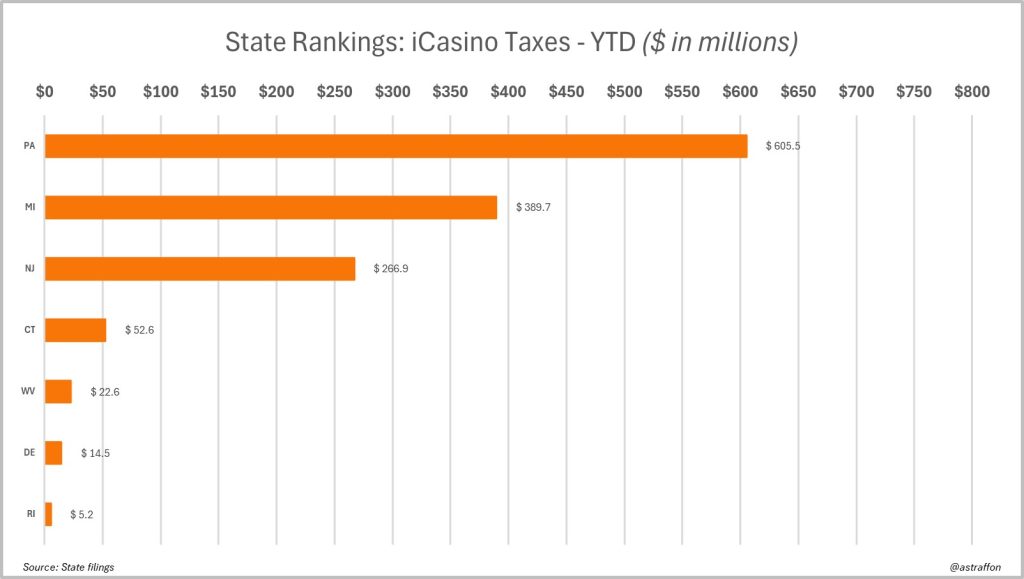
iGaming taxes generated, Year-to-date (2024)
 (Click to enlarge)
Key Takeaways
- Pennsylvania leads the way in tax revenue generated, owing in large part to a 54% rate on revenues derived from slot machine games.
This chart taken together with the iGaming GGR figures reveal that Michigan and New Jersey have become the most profitable states for operators, owing mainly to more modest applicable tax rates. Michigan applies a graduated rate that increases to 28% of adjusted gross revenue when an operator’s revenue exceeds $12 million; meanwhile in New Jersey, the number is a 17.5% effective rate on internet gaming revenue.
Pennsylvania’s tax on sports betting revenue is 36%, while the rate is variable on casino games — 16% on poker, 16% on non-peer-to-peer table games like blackjack, and 54% on slot machine games.
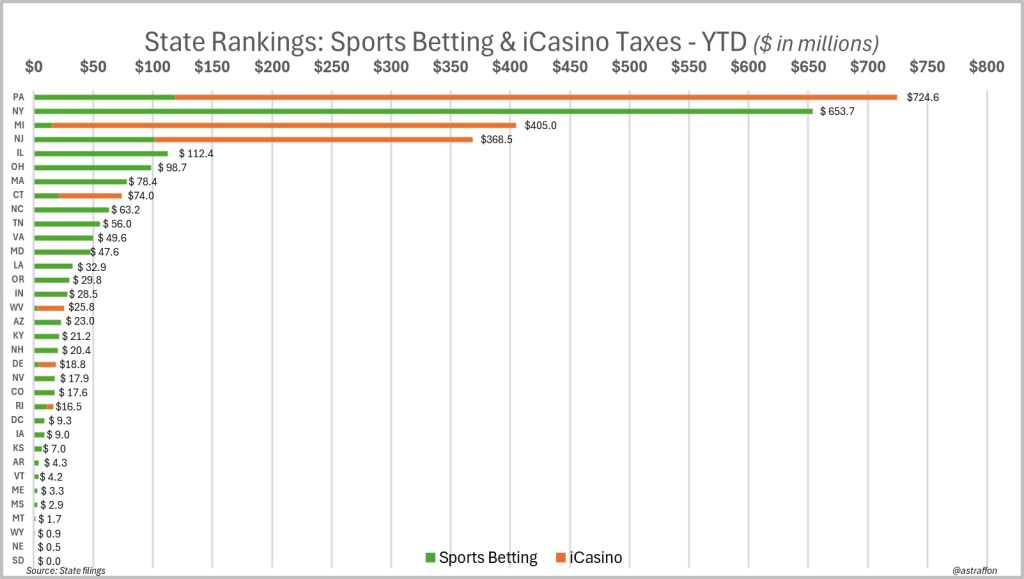
Sports betting and iCasino taxes data combined, Year-to-date (2024)
 (Click to enlarge)
Key Takeaways
- That is not a typo — New York has almost matched Pennsylvania with sports betting tax revenue alone.
- If or when New York does legalize iGaming, the chart will need to be modified to accommodate the discrepancy in bar sizes.
Important figures to note here: New York levies a nation-leading 51% tax on gross sports betting revenue on its nine active operators (DraftKings, FanDuel, Caesars, BetMGM, Fanatics, ESPN Bet, Resorts World Bet, Bally Bet, and BetRivers). Due to the monthly betting volume in New York that hovers between $1.5 and $2 billion, New York is nearly matching Pennsylvania’s revenue generation from iGaming and sports betting combined.
Selected data sources:
- Michigan Gaming Control Board
- New Jersey Division of Gaming Enforcement
- Pennsylvania Gaming Control Board
The post US Online Casino Data — Market Share By Brand, Gross Gaming Revenue Stats, And Taxation appeared first on Casino Reports.